
Map Gallery
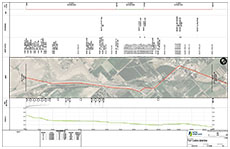
As-Built Alignment Sheet
The purpose of this sheet is to display engineering data in relation to the pipeline location and land base features. Built using the TemplateDesigner tool, the bands and summary table can be customized with a wide variety of data elements available to the client.
Download larger PDF sample (File size: 301 KB)
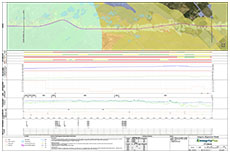
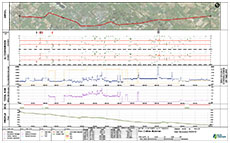
Integrity Alignment Sheet
The purpose of this sheet is to allow users to view important data specific to their Integrity Management Program all in one spot. This sheet gives a visual representation of HCA impacts, spill volumes, anomalies, geohazards, etc along a stretch of pipeline providing users with key information to make decisions and suggest what action needs to be taken.
Download larger PDF sample (File size: 749 KB)
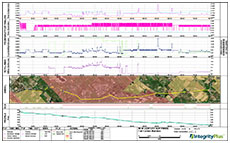
Risk Analysis Sheet
This sheet provides a focused alignment sheet for specific groups in an organization, such as integrity managers and engineers. Using a risk application such as New Century Software's Spatial Risk Analyst, data can be pulled in from a variety of external resources into a sheet to provide qualitative or quantitative risk results of a pipeline in order to determine threats and consequences and how they can be reduced.
Download larger PDF sample (File size: 472 KB)
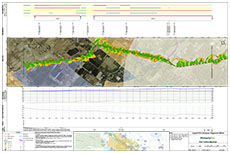
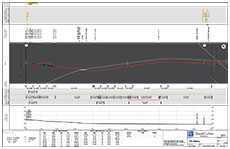
Liquid HCA Analysis Sheet
This sheet provides context around the GIS analysis results of a liquid spill. It allows users to visualize the High Consequence Areas that would be affected by a spill and the severity. The sheet can also provide needed documentation and notes on NHD flow traces, plume release intervals, and the simulated time of release for others to reference.
Download larger PDF sample (File size: 2,920 KB)
ILI Analysis Sheet
This sheet is designed to observe variations between data collected during an ILI run and the information stored in a pipeline GIS. Engineers and operators can use this style of map to determine locations and causes of corrosion and damage, and support decisions to make repairs. By using New Century Software's Alignment Manager users can maximize the value of their In-line Inspection data by loading it into a pipeline GIS and assisting in accurately locating anomalies.
Download larger PDF sample (File size: 353 KB)
History Sheet
This sheet is designed for GIS managers to track changes to GIS data over time. It allows users to easily visualize these changes and where they occur along the pipeline through a specified amount of time. This sheets allows the quality and accuracy of pipeline data to be traceable, verifiable, and complete.
Download larger PDF sample (File size: 351 KB)